
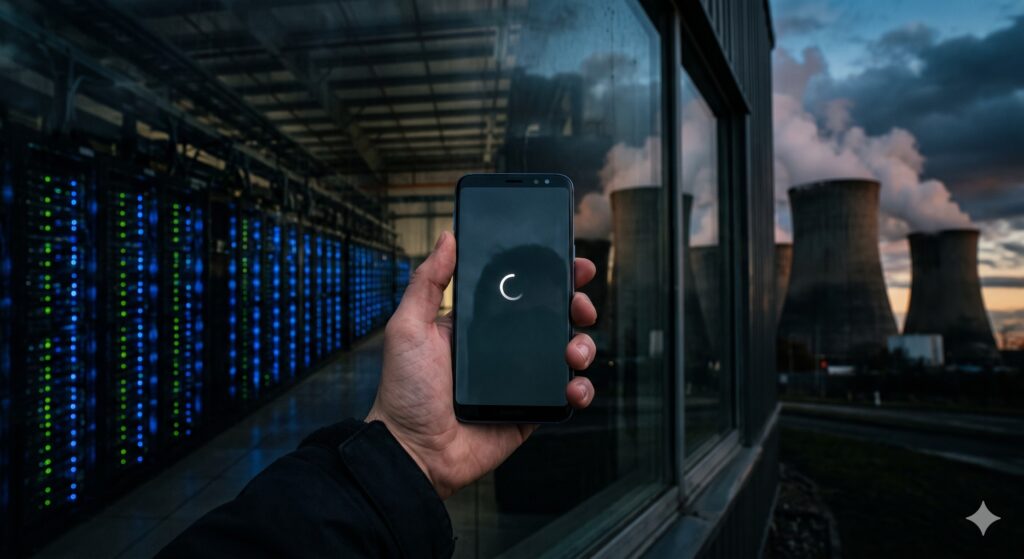
Behind every query lies a growing infrastructure of energy, water, land, and discarded hardware. A wave of recent research from the IEA, MIT, Nature Sustainability, and the United Nations is making the full picture harder to ignore.
A note on citations: Every statistic in this article is followed by an inline reference in brackets. Full source details are listed at the end. For web-based publications (IEA, Brookings, Pew), page numbers do not apply as the reports are structured as online chapters and section references are given instead. For PDFs, page numbers are given where accessible. For the UNU-INWEH report, the full PDF is available at inweh.unu.edu/publications (DOI: 10.53328/INR26RMA002); the figures cited here appear in the executive summary and body chapters of that document.
The standard way to talk about AI’s environmental impact is to talk about carbon. How much CO2 was emitted training GPT-4? What is the carbon footprint of a ChatGPT query? These are real questions with real answers, and the numbers are significant enough to take seriously. But a wave of research published over the last eighteen months is making a different argument: carbon is not the only relevant metric, and in some cases it is not even the most pressing one.
A comprehensive report released by the United Nations University Institute for Water, Environment and Health on June 3, 2026 put the case plainly: “The environmental costs of AI and data centers cannot be understood through carbon emissions alone.” [UNU-INWEH, 2026 — Executive Summary] The researchers, led by Professor Kaveh Madani, quantified the carbon, water, and land footprints of AI’s electricity use across the globe for the first time in a single study. What they found complicates the narrative considerably. Solutions that look green from a carbon perspective can be significantly worse for water or land. The communities bearing the physical costs of AI infrastructure are often not the communities capturing its benefits. And the measurement frameworks that most companies use to report environmental performance are structurally incomplete.
This post works through what the research actually says, dimension by dimension, and then asks what to make of the efficiency gains that the same period has produced.
The Energy Baseline
The starting point is electricity, because everything else flows from it.
According to the IEA’s landmark Energy and AI report published in April 2025, global data center electricity consumption reached approximately 415 terawatt-hours in 2024, representing about 1.5% of total global electricity demand [IEA Energy and AI, 2025 — Chapter 2, Section 2.2.1]. That figure has been growing at roughly 12% per year since 2017, more than four times faster than total global electricity consumption [IEA Energy and AI, 2025 — Chapter 2, Section 2.2.1]. The United States accounts for the largest share at around 45%, followed by China at 25% and Europe at 15% [IEA Energy and AI, 2025 — Executive Summary, p. 13].
In April 2026, the IEA published a follow-up report updating its projections. It found that data center electricity demand grew by 17% in 2025 [IEA Key Questions on Energy and AI, 2026 — Executive Summary]. More specifically, electricity consumption from AI-focused data centers grew by 50% in a single year [IEA Key Questions on Energy and AI, 2026 — Executive Summary]. The IEA’s central projection has global data center electricity consumption roughly doubling from 485 terawatt-hours in 2025 to 950 terawatt-hours by 2030, at which point it would represent about 3% of total global electricity demand [IEA Key Questions on Energy and AI, 2026 — Executive Summary]. AI-focused workloads within that total are projected to triple over the same period [IEA Key Questions on Energy and AI, 2026 — Executive Summary].
To put those numbers in context: by 2030, global data center electricity demand would be roughly equivalent to the combined annual consumption of Pakistan, Bangladesh, and Nigeria, countries collectively home to more than 650 million people [UNU-INWEH, 2026 — Executive Summary].
The geographic concentration of this demand matters as much as the aggregate. Ireland’s data centers already use more than 20% of the country’s national electricity supply [Brookings, 2026 — Section: “Geographic Concentration”]. In northern Virginia, they account for approximately 26% of the state’s total electricity consumption [Pew Research Center, 2025]. In 2023, a single electricity market stretching from Illinois to North Carolina reported that data centers accounted for $9.3 billion in additional capacity costs, expected to translate to electricity bill increases of $16 to $18 per month for average residential customers in the most affected states [Pew Research Center, 2025]. A Carnegie Mellon University study estimated that data centers and cryptocurrency mining together could add an 8% increase to the average US electricity bill by 2030, potentially exceeding 25% in the highest-demand markets [Pew Research Center, 2025].
The Carbon Picture
Electricity consumption does not translate directly to carbon emissions. The fuel mix powering a data center determines its emissions intensity, and that varies significantly by region and over time.
The IEA found that coal, with a share of about 30%, is currently the largest source of electricity for data centers globally, though this concentration is highest in China [IEA Energy and AI, 2025 — Chapter 3: Energy Supply for AI]. Renewables supply approximately 27%, natural gas 26%, and nuclear 15% [IEA Energy and AI, 2025 — Chapter 3]. The IEA projects that renewables will meet nearly half of the additional electricity demand from data centers between now and 2030, but also that natural gas and coal together will meet over 40% of the additional demand in the same period [IEA Energy and AI, 2025 — Chapter 3]. The result is that CO2 emissions from electricity generation for data centers are expected to peak at around 320 million tonnes by 2030 before entering a shallow decline [IEA Energy and AI, 2025 — Chapter 3].
Training frontier models represents the most visible energy use, and the numbers are striking. The UNU-INWEH report estimates that GPT-4 training likely consumed between 50 and 70 gigawatt-hours of electricity over approximately 100 days [UNU-INWEH, 2026 — Executive Summary]. To put that in context: with average US household electricity consumption running at around 10,500 kilowatt-hours per year [US EIA, 2023 Residential Energy Consumption Survey], training GPT-4 once consumed roughly as much electricity as 5,000 to 6,700 American homes use in an entire year. Projections for GPT-5-scale models suggest training electricity requirements approaching 100 gigawatt-hours [UNU-INWEH, 2026 — Executive Summary].
It is worth being precise about what contributes to the carbon footprint of an AI query. A 2026 Microsoft research paper by Oviedo and colleagues proposed a bottom-up framework for estimating inference energy under production-like conditions, accounting for GPU and CPU use, cooling overhead, network equipment, and data center infrastructure [Oviedo et al., 2026 — arXiv preprint]. Google’s own disclosure, published in August 2025, found that GPUs and TPUs account for only 58% of energy per Gemini prompt; the rest is consumed by CPUs, memory, redundancy systems, and data center overhead [Google / Elsworth et al., 2025 — arXiv:2508.15734, Section 4.3].
The per-query numbers vary significantly by model and task type. Google reported a median of 0.24 watt-hours per Gemini text prompt [Google / Elsworth et al., 2025 — arXiv:2508.15734, Figure 4]. OpenAI CEO Sam Altman disclosed approximately 0.34 watt-hours per average ChatGPT query [as reported by Earth911, March 2026, citing Altman’s June 2025 public statement]. Reasoning models tell a different story: research benchmarking 30 models found that o3 and DeepSeek-R1 consumed over 33 watt-hours per long prompt, more than 70 times the energy of simpler models for the same task [Jegham et al., cited in Earth911, 2026]. Generating a short video requires approximately 25 times the energy of a language query [IEA Energy and AI, 2025 — Chapter 1, Section 1.4.1].
Water: The Dimension Nobody Is Measuring
The water footprint of AI is, according to a 2025 study published in Nature Sustainability, “one of the most underexplored consequences of AI’s rapid expansion.” [Patterson et al., Nature Sustainability, 2025 — Abstract]
Data centers use water in two ways. Direct consumption refers to water used on-site, primarily for evaporative cooling in cooling towers. Indirect consumption refers to water used by power plants to generate the electricity that feeds the data center. Both are substantial, and neither is currently subject to comprehensive disclosure requirements.
Li and colleagues estimated that training GPT-3 in Microsoft’s US data centers required approximately 700,000 liters of on-site water for cooling alone, with total water consumption including the indirect footprint reaching around 5.4 million liters [Li et al., 2023, cited in the Expert Assessment of Systemic Environmental Risks of AI, arXiv:2512.11863, Section 3.2.2]. The same research group projected that global AI-related water withdrawals could reach 4.2 to 6.6 billion cubic meters annually by 2027, equivalent to four to six times the yearly water consumption of Denmark or roughly half that of the United Kingdom [Li et al., 2023, cited in arXiv:2512.11863, Section 3.2.2].
The UNU-INWEH report projects that by 2030, the water footprint of AI-related data center operations will equal the basic annual domestic water needs of all 1.3 billion people in Sub-Saharan Africa [UNU-INWEH, 2026 — Executive Summary].
The Nature Sustainability study found that AI servers in the United States alone could require between 731 and 1,125 million cubic meters of water annually by 2030 [Patterson et al., Nature Sustainability, 2025 — Abstract; doi:10.1038/s41893-025-01681-y]. For context, US data centers already consumed approximately 64 million cubic meters of water in 2023, with 84% of that used by hyperscale and colocation facilities [Pew Research Center, 2025, citing IEA 2024 data center report].
Geography compounds the problem. Many data centers are located in regions facing existing water stress. The UNU-INWEH researchers found that mapping data center construction against water stress regions frequently points to the same places [UNU-INWEH, 2026 — Chapter on Geographic Distribution]. The communities hosting these facilities are, in the words of one of the report’s co-authors, Dr. Mir Matin, often “not the ones using the AI being run there.” [UNU-INWEH press release, EurekAlert, June 3, 2026]
A further complication identified in the research is that measurement frameworks for water use are themselves inadequate. The standard Water Usage Effectiveness metric used by the industry measures annual site water use divided by IT equipment energy use, but it does not capture upstream water impacts, local water stress, or source sustainability [Privette et al., AGU Advances, February 2026 — doi:10.1029/2025AV002140]. A 2026 paper in AGU Advances found that data center operators lack the transparency and consistency in reporting to allow meaningful comparison or accountability [Privette et al., AGU Advances, 2026].
One important caveat on renewables: the UNU-INWEH report’s finding that “low-carbon is not automatically low-water or low-land” deserves careful attention. Switching from coal to bioenergy, for example, can cut carbon emissions per kilowatt-hour by about 70% on average while increasing the water footprint by more than thirty times and the land footprint by a hundred times [UNU-INWEH, 2026 — Executive Summary]. Decisions made in the name of decarbonization can shift environmental burdens without reducing them in aggregate.
Land Use and E-Waste: The Less-Discussed Footprints
The UNU-INWEH report is notable for including land use as a third environmental dimension, one almost entirely absent from previous industry reporting. By 2030, the researchers project that AI-related data center land use will exceed 14,500 square kilometers, roughly twice the area of the Jakarta metropolitan area, which is home to more than 32 million people [UNU-INWEH, 2026 — Executive Summary].
The e-waste dimension is growing in parallel. AI hardware refresh cycles are shorter than traditional IT equipment because newer chips process more data, run larger models, and operate more efficiently, meaning that older generations become economically obsolete faster. GPU lifespans in production AI environments typically run two to five years [Conservation Nebraska, citing MIT Technology Review, 2025].
The research group Gröger and colleagues estimated in 2025 that data center expansion between 2023 and 2030 may add approximately 4.2 million tonnes of e-waste to the existing global annual e-waste stream of 62 million tonnes [Gröger et al., 2025, cited in Expert Assessment arXiv:2512.11863, Section 3.3]. A broader estimate from Wang and colleagues put the total additional e-waste from generative AI alone between 2020 and 2030 at between 1.2 and 5 million tonnes [Wang et al., 2024, cited in arXiv:2512.11863, Section 3.3]. The UNU-INWEH report projects that AI infrastructure could generate up to 2.5 million tonnes of electronic waste per year by 2030 [UNU-INWEH, 2026 — Executive Summary].
E-waste from AI infrastructure has a disproportionate geographic distribution. Most of it is processed in low-income countries with limited safeguards. Globally, only about 22% of electronic waste is formally collected and recycled [IndexBox, April 2026, citing Global E-Waste Monitor data]. The critical minerals embedded in AI hardware, including rare earth elements required for chip manufacturing, are also primarily extracted in jurisdictions with weak environmental oversight, and semiconductor manufacturing waste reportedly doubled between 2016 and 2024 [Expert Assessment arXiv:2512.11863, Section 3.3, citing Hess, 2024].
The Efficiency Counterargument
An honest treatment of AI’s environmental footprint has to take the efficiency story seriously, because it is real and significant.
The IEA’s April 2026 update stated that the energy efficiency of AI is improving at a rate “unprecedented in energy history” [IEA Key Questions on Energy and AI, 2026 — Executive Summary]. Software and hardware advances have resulted in the energy cost per AI task dropping by at least an order of magnitude annually in recent years [IEA Key Questions on Energy and AI, 2026 — Executive Summary]. The AI supercomputer energy efficiency benchmark improved at approximately 1.34 times per year between 2019 and 2025 [EpochAI Trends in AI Supercomputers, arXiv:2504.16026, Figure 11].
Google published a detailed paper in August 2025 showing that over a twelve-month period from May 2024 to May 2025, the median energy consumption per Gemini text prompt decreased by 33 times and the associated carbon footprint by 44 times [Google / Elsworth et al., 2025 — arXiv:2508.15734, Section 4.3]. The gains were primarily software-driven, including a 23-fold reduction from model improvements alone [Google / Elsworth et al., 2025 — arXiv:2508.15734, Section 4.3].
DeepSeek’s training of its V3 model, disclosed in late 2024, demonstrated that competitive frontier capabilities could be achieved at a fraction of conventional training costs, partly through architectural innovations including Mixture-of-Experts approaches that activate only a subset of the model’s parameters for each query [Brookings, 2026 — Section: “Efficiency and DeepSeek”].
These are not marginal improvements. They represent genuine, large-scale reductions in the environmental cost of delivering a given unit of AI capability. The IEA notes that a simple text query now typically consumes less electricity than running a television over the same period [IEA Key Questions on Energy and AI, 2026 — Executive Summary].
The problem, and it is a structural one, is that efficiency gains and demand growth are moving in opposite directions, and demand is winning in absolute terms. More people are using AI. Energy-intensive uses, including long-context reasoning models and agentic systems that chain multiple queries to complete tasks, are growing as a share of total use. A reasoning model like o3 or DeepSeek-R1 can consume 70 times the energy of a lighter model for equivalent output [Jegham et al., cited in Earth911, 2026]. A single agent task that triggers a chain of operations can multiply the energy footprint of what appears to be one user request by an order of magnitude [Oviedo et al., 2026, as discussed in devsustainability.com analysis, May 2026]. The IEA’s updated projections reflect this: despite per-task efficiency improvements, total data center electricity consumption is still on course to double by 2030 [IEA Key Questions on Energy and AI, 2026 — Executive Summary].
This is a version of a well-known economic phenomenon sometimes called the Jevons paradox: improvements in efficiency tend to be outpaced by increases in consumption, because lower costs per unit make expanded use economically attractive. The history of computing supports this pattern. Computers became dramatically more energy efficient per computation between 1990 and 2010. Total computing energy consumption increased substantially over the same period.
The Disclosure Problem
Cutting across all of these dimensions is a transparency problem that makes the environmental picture harder to assess than it needs to be.
Only two AI companies, Google and OpenAI, have published specific per-query energy figures [Earth911, March 2026 — “Your AI Carbon Footprint”]. Google’s August 2025 paper provides detailed methodology [Elsworth et al., arXiv:2508.15734]. OpenAI’s figure came from a public statement by its CEO. Anthropic, which operates Claude, has not disclosed per-query energy figures and as of March 2026 has not reported Scope 1, 2, or 3 emissions in any public filing [Earth911, March 2026]. Microsoft Copilot, xAI’s Grok, and Apple have published no per-query environmental metrics [Earth911, March 2026].
The methodological inconsistencies in the figures that do exist are significant. Published per-query energy figures use different system boundaries, different definitions of what counts as infrastructure overhead, different assumptions about data center efficiency, and different carbon accounting rules [Brookings, 2026 — Section: “Transparency and Disclosure”]. Cross-model comparisons are therefore dependent on underlying assumptions that are rarely disclosed alongside the headline numbers.
This is not a minor reporting gap. It is a fundamental limitation on the ability of researchers, policymakers, and organizations to make informed decisions. The Logicalis 2026 Global CIO Report found that only 39% of CIOs are confident their organizations actively manage the environmental impact of their AI workloads [Logicalis, 2026 Global CIO Report, March 2026].
On June 23, 2026, UN Secretary-General António Guterres launched the AI Environmental Transparency Initiative at London Climate Action Week, calling on major AI companies to publicly disclose the full environmental impacts of their systems and commit to powering all data centers with renewable energy by 2030 [UNU-INWEH press release, EurekAlert, June 23, 2026]. The initiative was directly inspired by the UNU-INWEH report’s recommendations.
The Other Side of the Ledger
The research does not support a simple narrative of AI as environmental villain. The same IEA report that documents data center energy growth also identifies significant potential for AI to reduce emissions across the broader economy.
AI-based fault detection could reduce grid outage durations by 30 to 50% [IEA Energy and AI, 2025 — Executive Summary, p. 13]. AI optimization of transmission line capacity could unlock up to 175 gigawatts of additional transmission capacity without building new infrastructure, more than the entire projected increase in data center power load to 2030 in the IEA’s base case [IEA Energy and AI, 2025 — Executive Summary, p. 13]. AI applications in energy-intensive industries could reduce energy costs by 3 to 10 percentage points [IEA Key Questions on Energy and AI, 2026 — Executive Summary]. Google’s DeepMind system, applied to cooling optimization in its own data centers, reduced cooling energy consumption by approximately 40% [ExplainX.ai, June 2026, citing Google DeepMind published results].
In climate modeling, AI weather prediction systems including NVIDIA’s FourCastNet and Huawei’s Pangu-Weather have demonstrated skill comparable to conventional numerical weather prediction at a fraction of the compute cost [ExplainX.ai, June 2026]. The European Centre for Medium-Range Weather Forecasts integrated AI components into operational systems in July 2025 [ECMWF Media Centre News, July 1, 2025]. These applications carry material consequences for flood warning, storm tracking, and energy grid management during extreme weather events.
A 2025 paper published in npj Climate Action by Stern, Romani, Pierfederici and colleagues laid out the case for AI as a tool for the energy transition: optimizing grid management, forecasting renewable output, managing distributed energy resources, accelerating materials discovery for batteries and solar cells [Stern et al., npj Climate Action, 2025 — doi:10.1038/s44168-025-00252-3].
The honest position is that AI’s net environmental impact is genuinely uncertain and heavily dependent on how the technology develops and how it is governed. If AI substantially accelerates decarbonization of heavy industry, transport, and energy systems, the net effect on emissions could be positive even accounting for data center demand. If it primarily generates new consumer entertainment and knowledge work applications without displacing high-emission activities, the balance looks different.
What the Research Is Actually Asking For
The convergence of reports from the IEA, MIT, Nature Sustainability, UN University, Brookings, and multiple peer-reviewed journals is not a call to stop using AI. Professor Kaveh Madani’s framing in the UNU-INWEH report is worth quoting directly: “This report is not a case against artificial intelligence, a technological transformation that is improving the lives of billions of people around the world. It is a call for using it responsibly.” [UNU-INWEH, 2026 — Foreword / Executive Summary]
What the research consistently asks for is more specific: standardized environmental reporting covering carbon, water, and land footprints across the full lifecycle of AI systems; integration of AI infrastructure into national energy, water, and land-use planning; efficiency-by-design as a requirement rather than an afterthought; and governance frameworks that account for the geographic inequity of AI’s costs and benefits [UNU-INWEH, 2026 — Recommendations section; Privette et al., AGU Advances, 2026].
The UN Secretary-General’s transparency initiative, if it produces binding requirements, would address the disclosure gap that currently makes most other governance approaches difficult to implement. As Professor Madani put it: “We cannot properly manage what we do not measure.” [UNU-INWEH press release, EurekAlert, June 23, 2026]
For organizations using AI, the practical implication is that the environmental cost of AI workloads is not currently visible in the data most companies track. The energy consumption sits with cloud providers. The water use sits with data centers in other geographies. The e-waste arrives at the end of hardware refresh cycles. The carbon accounting typically uses contractual renewable energy certificates that may not reflect the actual fuel mix of the electricity physically consumed. Building a more accurate picture requires asking different questions of vendors and looking beyond the metrics that current sustainability reporting frameworks were designed to capture.
The infrastructure behind every AI prompt is profoundly physical. The research of the past eighteen months has made the scale of that physical footprint clearer than it has ever been. What happens with that clarity now is a governance and institutional question as much as a technical one.
Full Source List
[IEA Energy and AI, 2025] IEA. Energy and AI. April 2025. Paris: International Energy Agency.
[IEA Key Questions on Energy and AI, 2026] IEA. Key Questions on Energy and AI. April 2026. Paris: International Energy Agency.
[UNU-INWEH, 2026] Aczel, M., Chamanara, S., Matin, M., Farsi, A., Marwala, T., Madani, K. (2026). Environmental Cost of AI’s Energy Use: Carbon, Water and Land Footprints. United Nations University Institute for Water, Environment and Health (UNU-INWEH), Richmond Hill, Ontario, Canada.
[Patterson et al., Nature Sustainability, 2025] Patterson, J. et al. “Environmental impacts and net-zero pathways for sustainable artificial intelligence servers in the USA.” Nature Sustainability, 2025.
[Google / Elsworth et al., 2025] Elsworth, R. et al. “Measuring the environmental impact of delivering AI at Google Scale.” August 2025. arXiv: 2508.15734
[Oviedo et al., 2026] Oviedo, F. et al. “Energy use of AI inference: estimates and efficiency opportunities.” Microsoft Research, 2026.
[Brookings, 2026] Brookings Institution. “Global energy demands within the AI regulatory landscape.” April 2026.
[Pew Research Center, 2025] Pew Research Center. “What we know about energy use at U.S. data centers amid the AI boom.” October 2025.
[Privette et al., AGU Advances, 2026] Privette, A. et al. “Data Centers Water Footprint: The Need for More Transparency.” AGU Advances, February 2026.
[Expert Assessment arXiv:2512.11863] “Expert Assessment: The Systemic Environmental Risks of Artificial Intelligence.” arXiv:2512.11863, 2025.
[EpochAI, arXiv:2504.16026] “Trends in AI Supercomputers.” arXiv:2504.16026, 2025.
[Stern et al., npj Climate Action, 2025] Stern, N., Romani, M., Pierfederici, R. et al. “Green and intelligent: the role of AI in the climate transition.” npj Climate Action 4, 56 (2025).
[Earth911, 2026] “Your AI Carbon Footprint: What Every Query Really Costs.” Earth911, March 29, 2026.
[MIT News, 2025] Bashir, N. et al. “Explained: Generative AI’s environmental impact.” MIT News, January 2025.
[Logicalis, 2026] Logicalis. “2026 Global CIO Report.” March 2026.
[UNU-INWEH / EurekAlert press releases] June 3, 2026.
[US EIA, Residential Energy Consumption] US Energy Information Administration. 2023 Residential Energy Consumption Survey.
[ECMWF, 2025] ECMWF. “ECMWF’s Ensemble AI Forecasts Become Operational.” July 1, 2025.